Examples
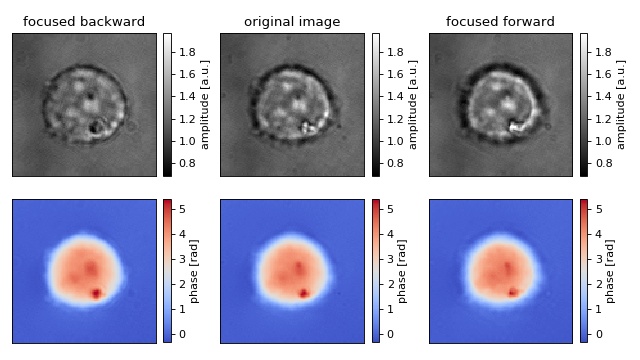
2D Refocusing of an HL60 cell
The data show a live HL60 cell imaged with quadriwave lateral shearing interferometry (SID4Bio, Phasics S.A., France). The diameter of the cell is about 20µm.
1 2 3 4 5 6 7 8 9 10 11 12 13 14 15 16 17 18 19 20 21 22 23 24 25 26 27 28 29 30 31 32 33 34 35 36 37 38 39 40 41 42 43 44 45 46 47 48 49 50 51 52 53 54 55 56 57 58 59 60 61 62 63 | import matplotlib.pylab as plt
import numpy as np
import unwrap
import nrefocus
from example_helper import load_cell
# load initial cell
cell1 = load_cell("HL60_field.zip")
# refocus to two different positions
cell2 = nrefocus.refocus(cell1, 15, 1, 1) # forward
cell3 = nrefocus.refocus(cell1, -15, 1, 1) # backward
# amplitude range
vmina = np.min(np.abs(cell1))
vmaxa = np.max(np.abs(cell1))
ampkw = {"cmap": plt.get_cmap("gray"),
"vmin": vmina,
"vmax": vmaxa}
# phase range
cell1p = unwrap.unwrap(np.angle(cell1))
cell2p = unwrap.unwrap(np.angle(cell2))
cell3p = unwrap.unwrap(np.angle(cell3))
vminp = np.min(cell1p)
vmaxp = np.max(cell1p)
phakw = {"cmap": plt.get_cmap("coolwarm"),
"vmin": vminp,
"vmax": vmaxp}
# plots
fig, axes = plt.subplots(2, 3, figsize=(8, 4.5))
axes = axes.flatten()
for ax in axes:
ax.xaxis.set_major_locator(plt.NullLocator())
ax.yaxis.set_major_locator(plt.NullLocator())
# titles
axes[0].set_title("focused backward")
axes[1].set_title("original image")
axes[2].set_title("focused forward")
# data
mapamp = axes[0].imshow(np.abs(cell3), **ampkw)
axes[1].imshow(np.abs(cell1), **ampkw)
axes[2].imshow(np.abs(cell2), **ampkw)
mappha = axes[3].imshow(cell3p, **phakw)
axes[4].imshow(cell1p, **phakw)
axes[5].imshow(cell2p, **phakw)
# colobars
cbkwargs = {"fraction": 0.045}
plt.colorbar(mapamp, ax=axes[0], label="amplitude [a.u.]", **cbkwargs)
plt.colorbar(mapamp, ax=axes[1], label="amplitude [a.u.]", **cbkwargs)
plt.colorbar(mapamp, ax=axes[2], label="amplitude [a.u.]", **cbkwargs)
plt.colorbar(mappha, ax=axes[3], label="phase [rad]", **cbkwargs)
plt.colorbar(mappha, ax=axes[4], label="phase [rad]", **cbkwargs)
plt.colorbar(mappha, ax=axes[5], label="phase [rad]", **cbkwargs)
plt.tight_layout()
plt.show()
|